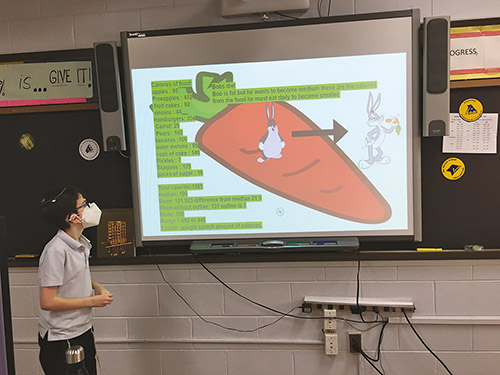
Moriah sixth grade students were learning to use measures of central tendency—learning statistics. They were asked to come up with data in any topic of their choice and do analysis on the data by finding the mean/average, median, mode, range and outlier of the data. They compared the mean with the outlier and without the outlier to make the analysis more meaningful (no pun intended). Some chose to do real life situations like growth in
Netflix use over the past eight years, sports team data—Payton Manning’s touchdown records throughout his career, Knick’s baskets scored for the season, mean Ugg prices in different stores, calorie intake, weight fluctuations, temperature changes, COVID cases and deaths in particular places, New York Giants scores for this year, Broadway earnings this year, etc. Students created powerpoint presentations using Google Slides to display their data and analysis. They also created either line or bar graphs to demonstrate trends or fluctuations in their data. This was a valuable hands on project to help them learn basic statistics. They did a fantastic job!